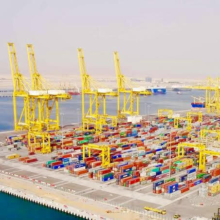
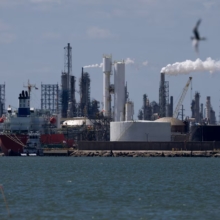
UAE’S Fujairah Aug marine fuel sales hit eight-month highs

RoydadNaft – Marine fuel sales at the UAE’s Fujairah, the world’s third-largest bunker hub, scaled eight-month highs in August, although volumes remained lower from a year-ago period, data showed.
Bunker sales at Fujairah provide a gauge of shipping market sentiment in the Middle East.
August bunker sales, excluding lubricants, were at 677,503 cubic metres, or about 671,000 metric tons, up 2.7% month-on-month but down 6.3% from the same month last year, according to the Fujairah Oil Industry Zone (FOIZ) data, which is published by S&P Global Commodity Insights.
Attractive discounts of delivered 380-cst HSFO bunker fuel versus cargo quotes could have spurred uptake in August, based on pricing data provided by industry sources.
Low-sulphur bunker sales of residual fuels and marine gasoils last month totalled 481,160 cubic meters, or about 477,000 metric tons, dipping 0.9% from levels seen in July.
Fujairah bunker sales by month, in cubic metres, excluding lubricants:
|
Month
|
Total Sales
|
M-o-M
|
Y-o-Y
|
|
Jan-23
|
633,023
|
-8.8%
|
-2.0%
|
|
Feb-23
|
572,371
|
-9.6%
|
-6.5%
|
|
Mar-23
|
559,800
|
-2.2%
|
-19.0%
|
|
Apr-23
|
596,330
|
6.5%
|
-10.3%
|
|
May-23
|
620,388
|
4.0%
|
-16.7%
|
|
Jun-23
|
605,374
|
-2.4%
|
-6.5%
|
|
Jul-23
|
659,566
|
9.0%
|
-0.8%
|
|
Aug-23*
|
677,503
|
2.7%
|
-6.3%
|
Monthly bunker sales by grade, in cubic metres:
|
Month
|
180cst LSFO
|
380cst LSFO
|
380cst HSFO
|
MGO
|
LSMGO
|
Lubricants
|
|
Jan-23
|
300
|
453,703
|
151,055
|
796
|
27,169
|
4,039
|
|
Feb-23
|
545
|
389,544
|
159,908
|
713
|
21,661
|
4,549
|
|
Mar-23
|
250
|
451,405
|
81,058
|
538
|
26,549
|
3,475
|
|
Apr-23
|
480
|
441,912
|
126,943
|
257
|
26,738
|
4,270
|
|
May-23
|
170
|
468,635
|
126,586
|
2,021
|
22,976
|
4,723
|
|
Jun-23
|
573
|
449,264
|
127,573
|
1,088
|
26,876
|
4,732
|
|
Jul-23
|
1,272
|
459,665
|
174,227
|
1,387
|
23,015
|
4,151
|
|
Aug-23*
|
0
|
450,420
|
196,343
|
459
|
30,281
|
4,587
|
(Data from the Fujairah Oil Industry Zone published by S&P Global Commodity Insights)