India’s industrial growth slows to … amid US tariffs on Russian oil imports
RoydadNaft – India’s industrial output slowed to 4% in August 2025 from 4.3% in July, hit by weak consumer demand and US tariffs on Russian oil imports. Manufacturing, capital goods, and consumer non-durables dragged growth, while mining and infrastructure showed resilience.
At a time when the US President Donald Trump has imposed a 25 per cent punitive additional tariff on India for buying Russian oil over and above the base tariffs of 25 per cent, the industrial output in the country has slowed down. The industrial activity in India slowed to 4% in August 2025 from its 6-month high growth of 4.3% in July. The main reason has been the reduced demands in the sectors of the consumer durables and non-durables sectors, as well as slower growth in manufacturing, capital goods, and infrastructure sectors, government data showed.
Key Highlights
- The IIP growth rate for the month of August 2025 is 4.0 percent which was 3.5 percent (Quick Estimate) in the month of July 2025.
- The growth rates of the three sectors, Mining, Manufacturing and Electricity for the month of August 2025 are 6.0 percent, 3.8 percent and 4.1 percent respectively.
- The Quick Estimates of IIP stands at 151.7 against 145.8 in August 2024. The Indices of Industrial Production for the Mining, Manufacturing and Electricity sectors for the month of August 2025 stand at 113.5, 151.6 and 221.1 respectively.
- Within the manufacturing sector, 10 out of 23 industry groups at NIC 2 digit-level have recorded a positive growth in August 2025 over August 2024. The top three positive contributors for the month of August 2025 are – “Manufacture of basic metals” (12.2%), “Manufacture of coke and refined petroleum products” (5.4%) and “Manufacture of motor vehicles, trailers and semi-trailers” (9.8%).
- In the industry group “Manufacture of basic metals”, item groups “MS slabs”, “HR coils and sheets of mild steel” and “Pipes and tubes of Steel” have shown significant contribution in growth.
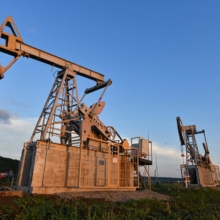
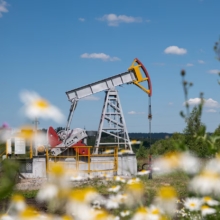
- In the industry group “Manufacture of coke and refined petroleum products”, item groups “Diesel”, “Petrol/ motor spirit”, and “Liquefied Petroleum Gas (LPG)” have shown significant contribution in growth.
- In the industry group “Manufacture of motor vehicles, trailers and semi-trailers” item groups “Auto components/ spares and accessories”, “Axle” and “Commercial Vehicles” have shown significant contribution in growth.
- As per the use base classification, the indices stand at 148.9 for Primary Goods, 112.1 for Capital Goods, 170.4 for Intermediate Goods and 200.8 for Infrastructure/ Construction Goods for the month of August 2025. Further, the indices for Consumer durables and Consumer non-durables stand at 134.4 and 132.8 respectively.
- The corresponding growth rates of IIP as per Use-based classification in August 2025 over August 2024 are 5.2 percent in Primary goods, 4.4 percent in Capital goods, 5.0 percent in Intermediate goods, 10.6 percent in Infrastructure/ Construction Goods, 3.5 percent in Consumer durables and (-)6.3 percent in Consumer non-durables (Statement III). Based on use-based classification, top three positive contributors to the growth of IIP for the month of August 2025 are Primary goods, Infrastructure/ construction goods and Intermediate goods.